296 million spins on book of dead: not one of 20 scanned casinos was confirmed on the published version
exp · 004 · 2026-06-12 · simulation-based
last updated 2026-07-03
Run it yourself in the live simulator. All figures are simulation-based observations, not predictions. See our methodology.
what we measured
| parameter | value |
|---|---|
| configs simulated | 96.21% (provider default) · 94.25% (modal deployed) · 87.25% (deployed floor) |
| known variant ladder | 96.21 / 94.25 / 91.25 / 87.25 / 84.18, a verified 12.03pp spread |
| stakes | $0.20 / $0.50 / $1.00 per spin |
| bankrolls | $50 / $100 / $200 |
| sessions | 10,000 per stake/bankroll cell, 90,000 per config, 270,000 total |
| spin cap | 2,000 spins per session |
| play model | flat stake, all 10 lines, optional gamble feature not used |
the question this answers: book of dead's published math describes a version most players never see, so how do bankrolls actually behave on the version most casinos deploy, measured against the brochure number?
model inputs worth flagging: play'n go does not publish hit frequency or bonus trigger rate. we used a single community tracker's large-sample estimates (hit 26.16%, free spins 1 in 192.2, average bonus 81.28x, from 8.32M tracked spins), low-confidence inputs, documented as estimates. all three configs share them, so the cross-version deltas below are insensitive to that uncertainty; absolute session-length and bonus-gap figures inherit it.
how long bankrolls survived
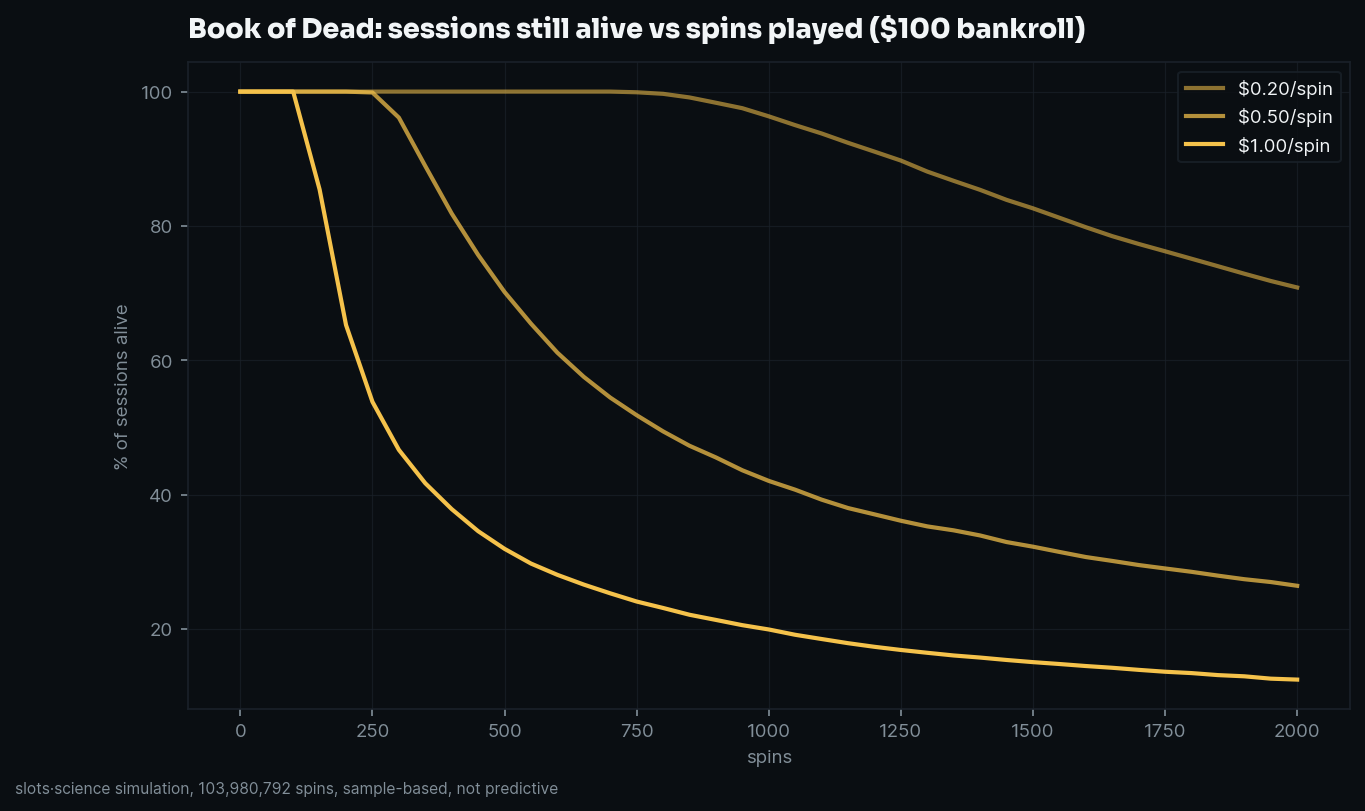
at the $100 bankroll (default config), the stake sets the clock: median session length was 274 spins at $1.00, 788 spins at $0.50, and the full 2,000-spin cap at $0.20. the $1.00 curve falls off a cliff almost immediately, half of those sessions were dead before spin 274, which at real-world pace (~5 spins a minute) is under an hour. the deployed versions compress everything: at $0.50/$100 the median session shrank from 788 spins (default) to 744 (94.25 config) to 584 (87.25 floor).
bust rates
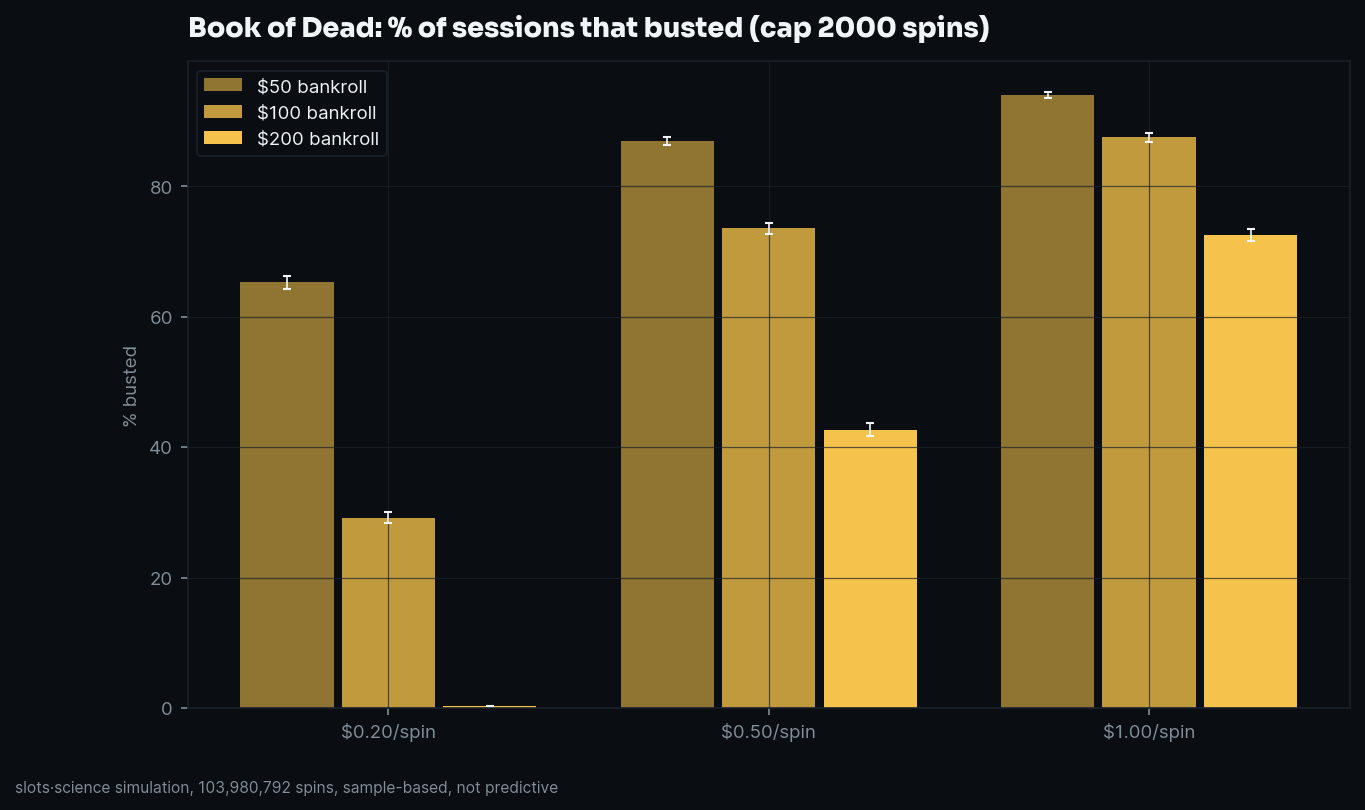
bust rates within the 2,000-spin cap, default 96.21 config, 95% CIs:
| $50 bankroll | $100 | $200 | |
|---|---|---|---|
| $0.20/spin | 65.2% ±0.9 | 29.2% ±0.9 | 0.3% ±0.1 |
| $0.50/spin | 86.9% ±0.7 | 73.6% ±0.9 | 42.7% ±1.0 |
| $1.00/spin | 94.0% ±0.5 | 87.5% ±0.7 | 72.5% ±0.9 |
plain reading: hold the bankroll at $100 and move the stake from $0.20 to $0.50, and the bust rate jumps from 29.2% to 73.6%, the single biggest lever in the grid. the only cell where busting is rare is $0.20 against $200 (0.3%), which is also the cell with 1,000 spins of cover per bankroll. dead streaks were unremarkable for a high-volatility title: the 90th-percentile session's worst winless run was 25 spins at $0.50/$100; the longest observed anywhere in 90,000 default-config sessions was 60 spins (a sample observation, not a distribution claim).
the bonus wait, and what it pays
at the tracker-estimated trigger rate of 1 in 192.2, a model input, and a low-confidence one, our simulated sessions averaged one free-spins round every ~192 spins, as expected. the payout side is where the texture is (model-based estimates; 500,027 simulated bonuses pooled, default config): the average bonus paid 81.2x stake, but the median was 44.4x, half of all bonuses paid less than that. 23.3% paid under 20x, 54.3% under 50x. the top 1% paid 572.7x or more, and the 5,000x cap was reached in sample. that gap between the 81x average and the 44x median is the whole game: the expanding-symbol round carries the math on rare big hits, and the typical round pays well under the average everyone remembers.
a $50 bankroll at $1.00/spin affords 50 spins of cover against a 1-in-192 trigger, most of those sessions (94.0% busted) never saw the feature at all.
what a finished session looks like
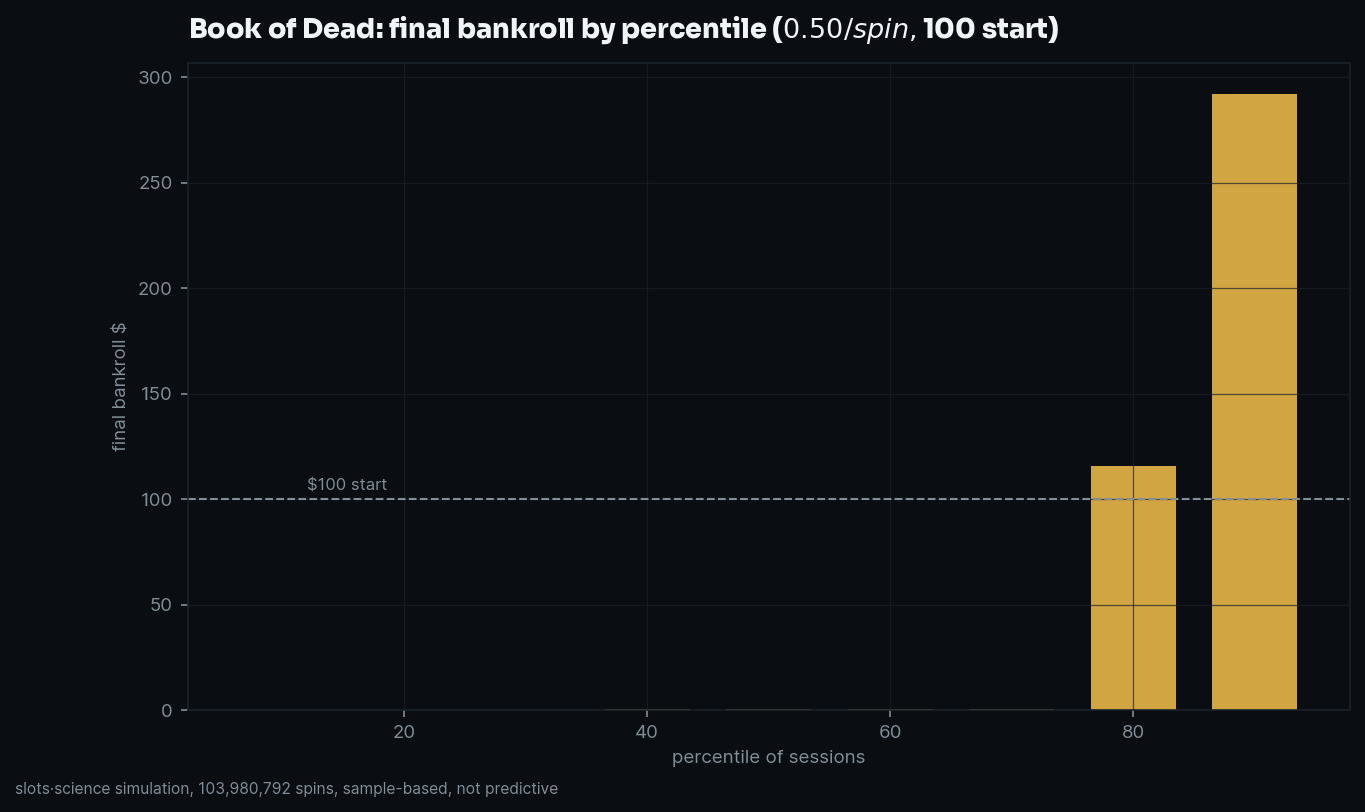
the final-bankroll distribution at $0.50/$100 (default config) is two stories with nothing in between: half of all sessions ended with less than $0.35 of the original $100, and 70% ended below $0.48, busted, in effect. then the distribution jumps: the 80th percentile kept $115.79 and the 90th kept $291.96. book of dead sessions don't drift to a middling result; they either die or detonate upward, which is what a 10-line high-volatility engine with a 5,000x ceiling is built to do.
there is no bonus-buy section in this study: book of dead (2016) has no feature buy, no multipliers, and no ante, the classic engine predates all of it, so there is nothing to measure.
the rtp version lottery
this is the section book of dead was made for. the game ships at 96.21%, and also exists at 94.25, 91.25, 87.25 and 84.18: a fully verified 12.03pp ladder, the widest on our files, across which the house edge more than quadruples (3.79% → 15.82%).
here is the part that isn't theoretical. FindMyRTP's july 2026 scan of 20 casinos confirmed not one of them on the certified 96.21% top setting. twelve ran 94.25 (including leovegas, wildz and rizk), three ran 91.25, and one ran the 87.25 floor, sixteen of twenty confirmed on a lower rung of the ladder (operator RTPs as displayed in-game, scan data current as of july 2026; casinos can change versions at any time). one casino displayed 96.32, a figure that matches no certified version of this game and that our QA later found appearing identically across unrelated titles, so we score it as a display artifact, not a sighting (correction (2026-07-03): an earlier revision of this study read that display as a top-version sighting and named the casino as the sole top-setting operator; that claim is withdrawn). for this title, the published number is a version we could not confirm anywhere, the lower rungs are the rule. a community tracker's realised return of 93.8% over 8.32 million real spins sits almost exactly on that deployment picture. so we didn't just simulate the brochure; we ran the full grid at the deployed versions too. measured deltas, same model, same inputs, only the rtp changed:
| cell | 96.21 default | 94.25 (12 of 20 casinos) | 87.25 (deployed floor) |
|---|---|---|---|
| $0.20/$100 bust | 29.2% ±0.9 | 32.9% ±0.9 (+3.7pp ±1.3) | 47.8% ±1.0 (+18.6pp ±1.3) |
| $0.50/$100 bust | 73.6% ±0.9 | 75.3% ±0.9 (+1.7pp ±1.2) | 84.0% ±0.7 (+10.4pp ±1.1) |
| $0.50/$200 bust | 42.7% ±1.0 | 46.8% ±1.0 (+4.1pp ±1.4) | 60.6% ±1.0 (+17.9pp ±1.4) |
| $1.00/$200 bust | 72.5% ±0.9 | 76.0% ±0.8 (+3.5pp ±1.2) | 84.1% ±0.7 (+11.6pp ±1.1) |
| $0.20/$200 bust | 0.3% ±0.1 | 0.5% ±0.1 | 1.8% ±0.3 |
| median session, $0.50/$100 | 788 spins | 744 spins | 584 spins |
the modal deployed version raised the bust rate's point estimate in all nine cells, statistically significant in eight of nine (everywhere except $1.00/$50, where sessions die too fast for 2pp of rtp to resolve). the floor raised it in all nine. the safest cell in the grid, $0.20 against $200, saw its bust rate go from 0.3% to 1.8% between the default and the floor: six times as many busted sessions, purely from which version the casino licensed. same game, same symbols, same free spins. the only difference is a setting you can't see.
(the 84.18 floor of the ladder exists in the verified math but has no deployment sighting on file; we did not simulate it.)
methodology note
we simulate models calibrated to published math, rtp, hit frequency, volatility profile, bonus behavior, not the provider's game engine. results are sample-based observations from 296 million simulated spins (270,000 sessions across three rtp configurations), with 95% confidence intervals shown. hit frequency and bonus trigger rate are single-tracker community estimates, used as documented model inputs. slots are negative-expectation games; nothing here predicts outcomes or improves odds. model and validation data: bod-v1 (96.21 target, analytic calibration exact, 10M-spin check measured 96.325% ±0.366pp se), bod-v1@94.25 (measured 94.360% ±0.364pp se), bod-v1@87.25 (measured 87.342% ±0.357pp se), all within tolerance. corrections policy: methodology.html.
Where the max win actually comes from
44% of this game's RTP is locked inside the bonus you rarely trigger; the base game on its own returns just 54%.
A normal spin in our simulation never returned more than ~500x (€250). The 5,000x top win is a feature event, it only came out of the bonus. (base-game ceiling: paytable-sourced)
Play the Book of Dead demo, or stress-test it
Looking for the Book of Dead demo or free play? A demo shows you a handful of spins. Our free simulator runs Book of Dead across thousands of sessions and shows what actually happens to a bankroll over time: the bust rate, how long the money lasts, and the wait for the bonus. It is the demo with the math switched on.
Every new study, as it publishes
No feed games: one Telegram digest with each study's headline numbers, the week it lands.
get the weekly digest on telegram
FAQ
What is the real RTP of Book of Dead?
The default published RTP we modelled is 96.21%. It also ships in lower published versions (ladder: 96.21%, 94.25%, 91.25%, 87.25%, 84.18%), and the casino, not the game, picks which one runs; check the RTP in the game's info panel.
Is Book of Dead a tight slot? How many sessions bust?
In our simulation at the default RTP, 73.6% of $0.50-a-spin sessions on a $100 bankroll busted before the 2,000-spin cap. That is a measured session cost across thousands of simulated sessions, not a prediction for your next one.
How often does the Book of Dead bonus hit?
About once every 192 spins on average in our simulation, roughly 38 minutes at five spins a minute. Real gaps vary widely around that average, and a bonus is never "due".
Is there a Book of Dead demo or free play?
Yes. You can play Book of Dead in demo mode at most casinos, and you can stress-test it free in our simulator, which runs thousands of sessions and reports the bust rate and session length, the demo with the math switched on.
Is Book of Dead worth playing?
It is negative-expectation like every slot. In our simulation, 73.6% of $0.50/$100 sessions busted before the 2,000-spin cap. We report the cost; we never tell you to play.
Related studies
- Fire Joker
- Legacy of Dead
- Moon Princess
- the full RTP database, how often slots really pay, aggregated
- all 101 studies