We simulated 100,000 bonus buys on each of 50 slots. On the harshest, 87.0% returned less than they cost
by slots·science lab · published 2026-07-27
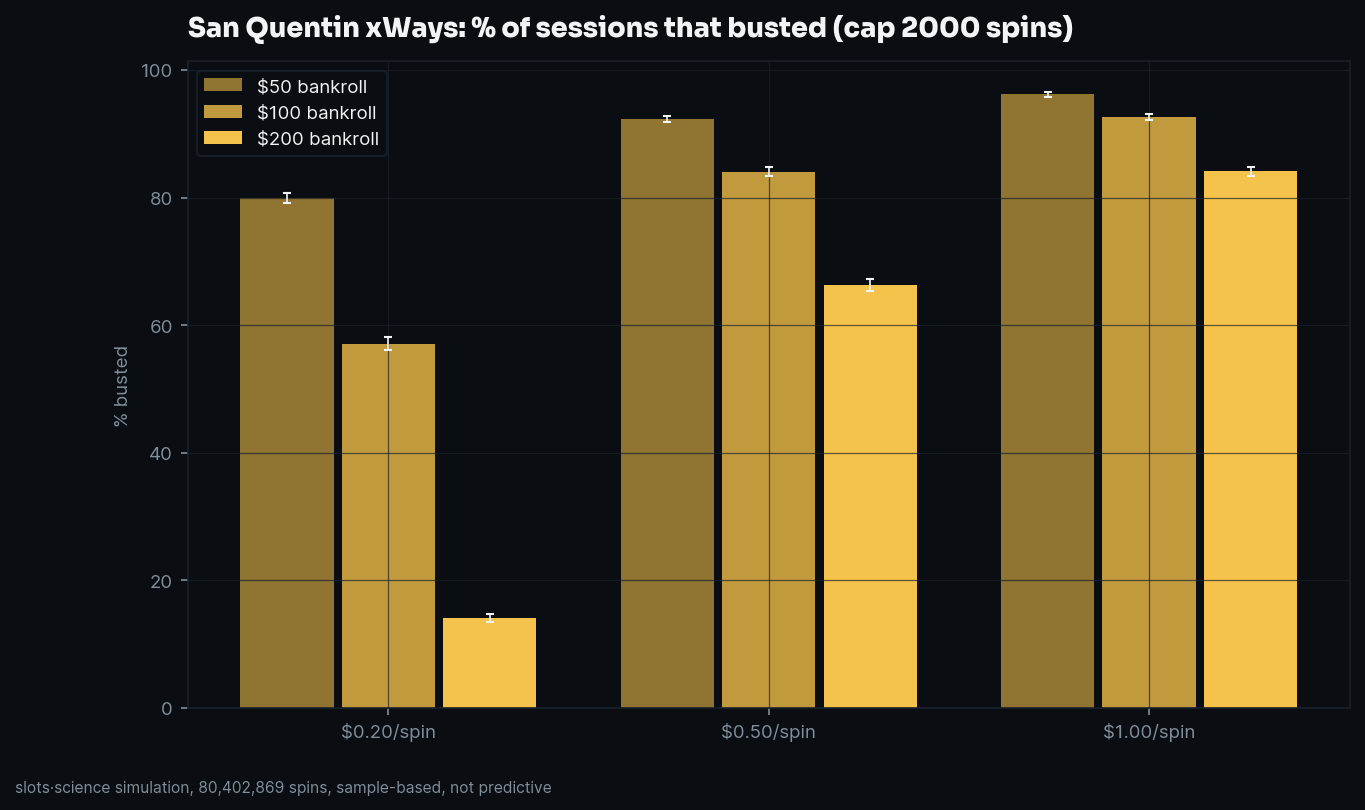
The buy that skips the wait, not the odds
Feature buys exist because bonus rounds are rare and buying one skips straight to it. What they don't skip is the house edge: across all 50 games in the lab, the average return on a buy tracks the game's RTP almost exactly, buy the feature on a 96.03%-RTP game and, averaged over enough buys, you get back close to 96.03% of what you spent. That much matches the marketing.
The number that doesn't get marketed is the median. Because a handful of huge multipliers drag the average up, the buy the typical player experiences returns a small fraction of its cost. On San Quentin xWays, the harshest game we tested, the median 100x buy returned 0.085x, about 8.5 cents back per dollar spent, even though the average was 96.03% of stake.
The three harshest buys in the lab
- San Quentin xWays (Nolimit City, 96.03% modelled RTP): the 100x buy returned less than its cost on 87.0% of buys, and less than half its cost on 79.02%. Median return: 0.085x. Only 1.54% hit 10x the buy or more; the single biggest result in 100,000 buys was 1,500x the buy (150,000x the base stake), hit on 0.001% of buys.
- Fire in the Hole 2 (Nolimit City, 96.07%): the 70x buy lost money on 86.93% of buys (78.97% lost more than half). Median return: 0.0864x. 1.5% hit 10x+; the biggest of 100,000 buys returned 928.57x the buy (65,000x stake).
- Tombstone R.I.P. (Nolimit City, 96.47%, the one game here where the buy RTP is provider-published rather than modelled off the base game): the 70x buy lost money on 86.91% of buys (79.07% lost more than half). Median return: 0.0861x. 1.5% hit 10x+; the biggest result was 574.49x the buy (40,214x stake), nowhere near the game's 300,000x ceiling, which no buy in the sample reached.
All three are Nolimit City titles, and all three show the same shape: roughly four in five buys return less than half their cost, roughly seven in eight return less than the full cost, and the average is rescued entirely by outcomes that hit fewer than 2% of the time.
Even the gentlest game on the list
Move to the other end of the 50-slot ranking and the picture softens but never flips. 5 Lions Megaways, the mildest of the 50, still returned less than the buy's cost on 77.57% of simulated buys, with a 0.32x median. Between the harshest and gentlest games in the lab, the share of losing buys moved from 87.0% down to 77.57%: a real difference in how brutal a specific buy is, but every single one of the 50 games cleared "most buys lose."
Does paying more for the feature help?
No, and the per-slot studies test this directly. On San Quentin xWays, stepping from the 100x buy up to the 2,000x buy barely moved the numbers: average return stayed at 96.03% (the model RTP doesn't change with stake), median crept from 0.085x to 0.0982x, and the losing-buy share only dropped from 87.0% to 85.52%. Fire in the Hole 2 showed the same pattern across its four tiers, from 70x up to 3,600x. The bigger buy is not better value, it is the same expectation at a higher price, spread over the same shaped distribution.
What this is and isn't
Every buy tier on every one of these 50 games is negative-expectation, and no buy amount changes that. What the data shows is narrower and more useful than a strategy: the average return you'd expect from thousands of buys and the return a single buy actually delivers are two very different numbers, and the gap is largest on exactly the games where the marketing leans hardest on big multiplier ceilings. None of this is a route to profit, and nothing here should be read as advice to buy a feature round.
Simulation-based observations, not predictions. Every figure traces to the full 50-slot bonus-buy lab and its per-slot study drafts, calibrated per our methodology. 18+, if gambling stops being fun, please stop.
Read the source studies
- San Quentin xWays, the full lab study
- Fire in the Hole 2, the full lab study
- Tombstone R.I.P, the full lab study
- the full RTP database
Every new study, as it publishes
No feed games: one Telegram digest with each study's headline numbers, the week it lands.
get the weekly digest on telegram
Simulation-based observations, not predictions. We never advise betting. 18+, play responsibly.